A Red Candle Means "Up" in Taipei and "Down" in New York
Candlestick charts encode direction in three independent conventions, and every charting library ships the Western default. Half your readers are reading the opposite chart.
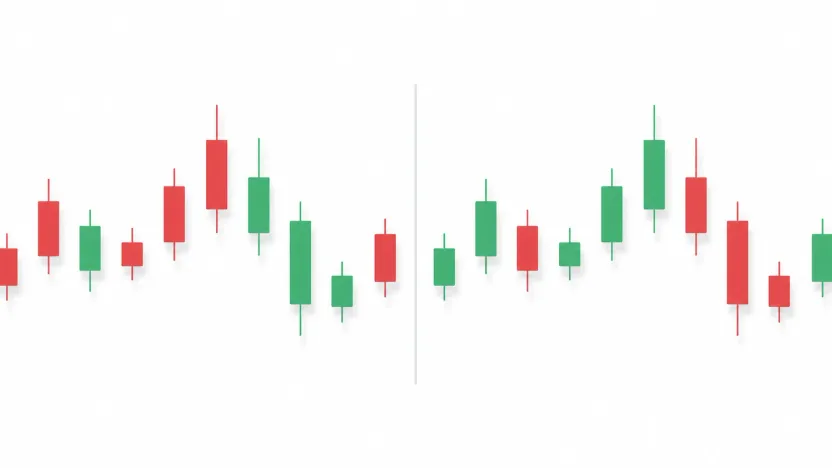
A colleague in Taipei looks at your trading dashboard and says the stock is up. You are looking at the same screen and you can see it is down. Neither of you is wrong.
Three conventions, all optional, all defaulted for you
A candlestick bar looks like one mark, but it carries direction through three independent choices, and your charting library made all three for you:
- Which colour means up. Green-up is standard in the US and Europe. Red-up is standard in Taiwan, mainland China, Japan and Korea, where red is the colour of fortune and prosperity. These are exact opposites.
- Whether the body is hollow. Hollow candlesticks fill the body only when the bar closed below its own open, which is a different question from the one the colour answers.
- What “up” is measured against. This bar’s open, or the previous bar’s close.
Every major library defaults to green-up and measures against the bar’s own open. If your readers are in Asia, the default is backwards for them, and nobody will file a bug about it — they will just quietly misread the chart.
The two definitions of “up” genuinely disagree
This is the part that surprises people who have used candlesticks for years. Switch the basis selector below and watch the bars change colour.
16 of 32 candles are red right now
3 candles change direction between the two bases. Both bases are industry standard, and they disagree.
On the 32-bar series above, three bars flip direction depending on the basis — about one bar in eleven. It happens wherever a bar opens away from the previous close: the bar can rise from its own open while still closing below where the previous bar ended. Under one industry standard it is green; under the other it is red. Both libraries are correct by their own documentation.
There is a second thing worth noticing while you are in there. With the basis set to “this bar’s open,” hollow and colour are perfectly correlated — every up bar is hollow, every down bar is filled, and hollow looks like decoration. Switch the basis to “the previous close” and hollow starts carrying information the colour does not have. That is the whole reason hollow candlesticks exist, and it is invisible until you change the basis.
That ratio is not a property of candlesticks in general — it is a property of how much this series gaps. A market with frequent overnight gaps will disagree more often; a continuously traded instrument will disagree less. Which is exactly why you should measure it on your own data rather than trust a number from someone’s blog.
The colour-blind problem is worse here than anywhere else
A candlestick chart in its default configuration encodes the single most important fact on the chart — did this go up or down — in red versus green hue alone. That is the worst case for the roughly 8% of men with red-green colour vision deficiency, and it is the most common chart type in finance.
Hollow versus filled bodies fix this almost for free, because they carry direction in a channel that has nothing to do with hue. If you only change one thing after reading this, turn hollow candles on. (There is a tool on this site for checking the rest of your palette.)
What to actually do
- State the convention on the chart. A four-word legend — “red = up” — costs nothing and removes the entire ambiguity.
- Turn on hollow bodies. Direction stops depending on hue, which helps colour-blind readers and anyone looking at a projector or a printout.
- Pin down the basis in your data layer, not the chart. Compute direction yourself against whichever basis your users expect, and pass it to the chart as a field. Then a library upgrade cannot silently change what your chart means.
Common follow-ups
Which colour convention is correct?
Neither. Green-up is standard in the US and Europe; red-up is standard in Taiwan, mainland China, Japan and Korea, where red is the colour of good fortune. If your audience spans both, colour alone cannot carry the meaning.
What is the difference between hollow and filled candles?
Hollow encodes close versus this bar's open, which is a different question from the one the colour answers. That is the point of hollow candlesticks — you get two independent facts per bar instead of one. A hollow red bar is not a contradiction: the bar rose from its own open but still closed below the previous bar.
Why do two charts of the same data disagree about which bars are up?
Because "up" has two standard definitions. Against this bar's open, or against the previous bar's close. When there is an overnight gap the two answers differ, and both libraries are behaving correctly by their own documentation.
How should I label direction if I cannot rely on colour?
Encode it twice. Hollow versus filled bodies carry direction without hue, and so do an explicit legend and a stated basis. This is the same fix that makes charts readable to colour-blind readers, which matters more than usual here.